
The overview page gives you an overall glance system, highlighting three main parameters of the system, Orders, Inventory and the channels.
On the UI > Dashboard> Overview

Section 1
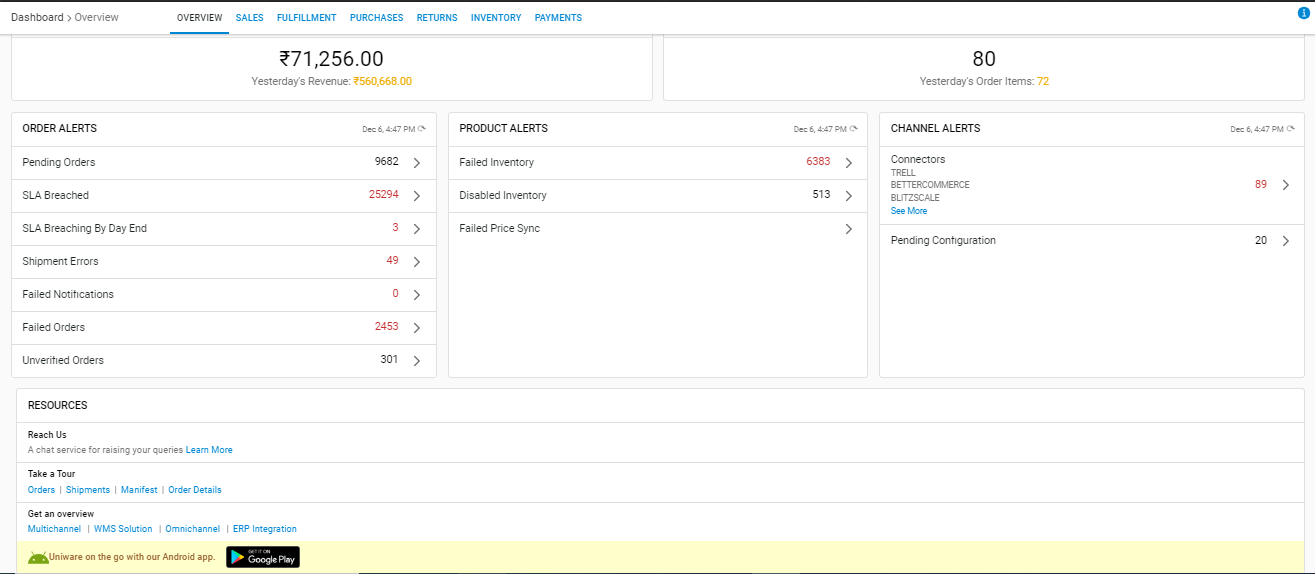
In the first section, Revenue and Orders Items sold on the present/previous day can be checked.
Section 2
1-In the Orders grid (Order Alerts) you can see the number of pending orders (which are created or in processing state) and those whose SLA has been breached.
2-The Inventory grid (Product Alerts) gives you the number of Failed and Disabled Inventory.
3-The Channel Connectors grid (Channel Alerts) highlights the number of broken connectors and those channels which still need to be configured in the system.
Section 3
This section covers the latest product updates under the Announcement section and another Unicommerce information repository under the Resources Tab.
Eg:-
- SLA Breach Shipments Count: this count will show the SLA breached orders of past 1 year till (now() – 1second) time.(filter on fulfilment TAT column).
- SLA About to breach shipment count: this count will show the SLA about to breach with time filter now() to next day 00:00:00(filter on fulfilment TAT column).
- Shipment Error Count: this will show all the shipment error count of the current facility.
- Failed Notification Count: this will show all the failed notification count of the tenant.
_________________________________________________________________________