
The sales dashboard is the graphical representation of the dashboard highlighting the revenue earned and items sold on each channel. The revenue can be calculated for a day, month and quarter of a year. This page also shows you a table of the Top performing channel(s), products and categories.
To Check, Go to Dashboard> Sales

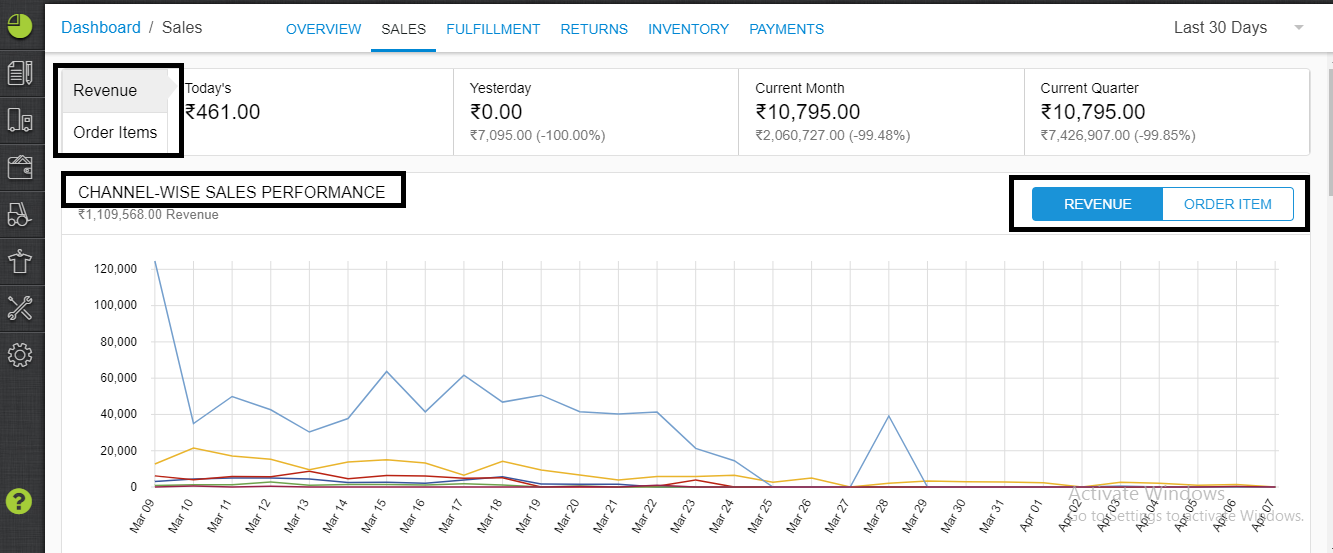
Section 1
This covers the consolidated information of the Revenue and Order Items sold over a period of time. (Same/previous day, current month and current quarter) and
CHANNEL-WISE SALES PERFORMANCE
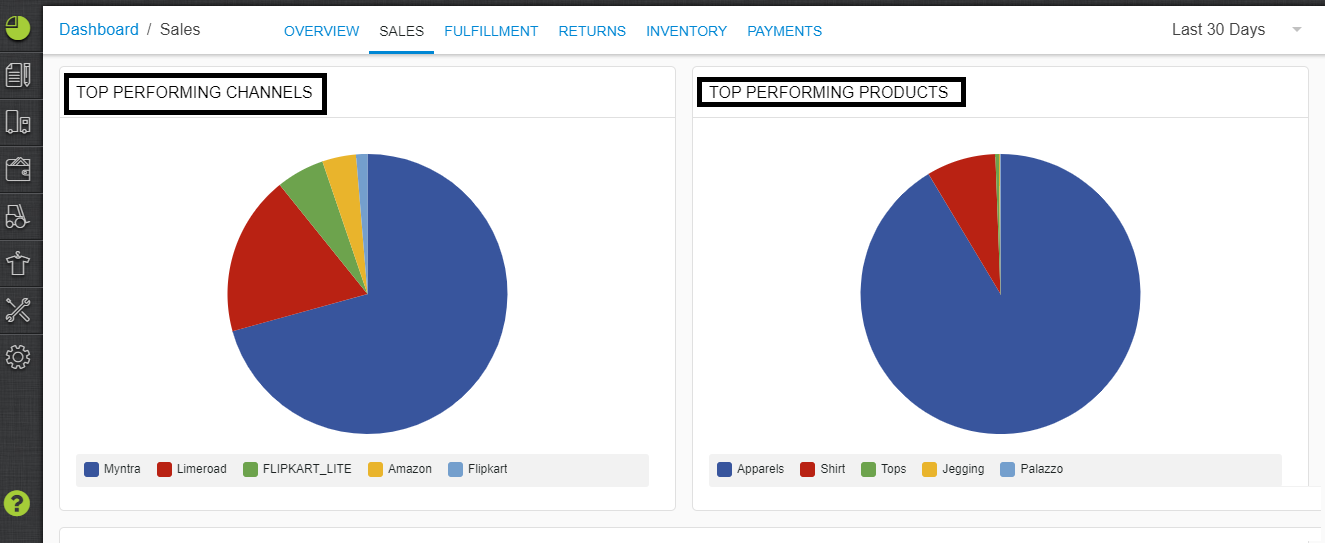
Section 2
Graph of TOP PERFORMING CHANNELS and TOP PERFORMING PRODUCTS
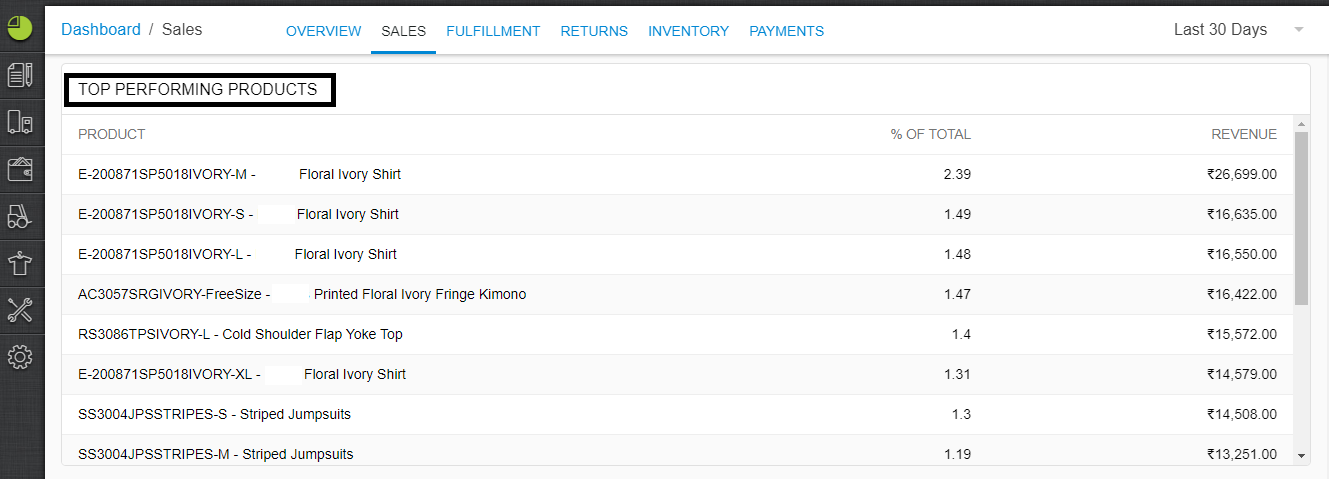
Section 3
Based on detailed analysis of your system and business trends, this section covers the list
TOP PERFORMING PRODUCTS details
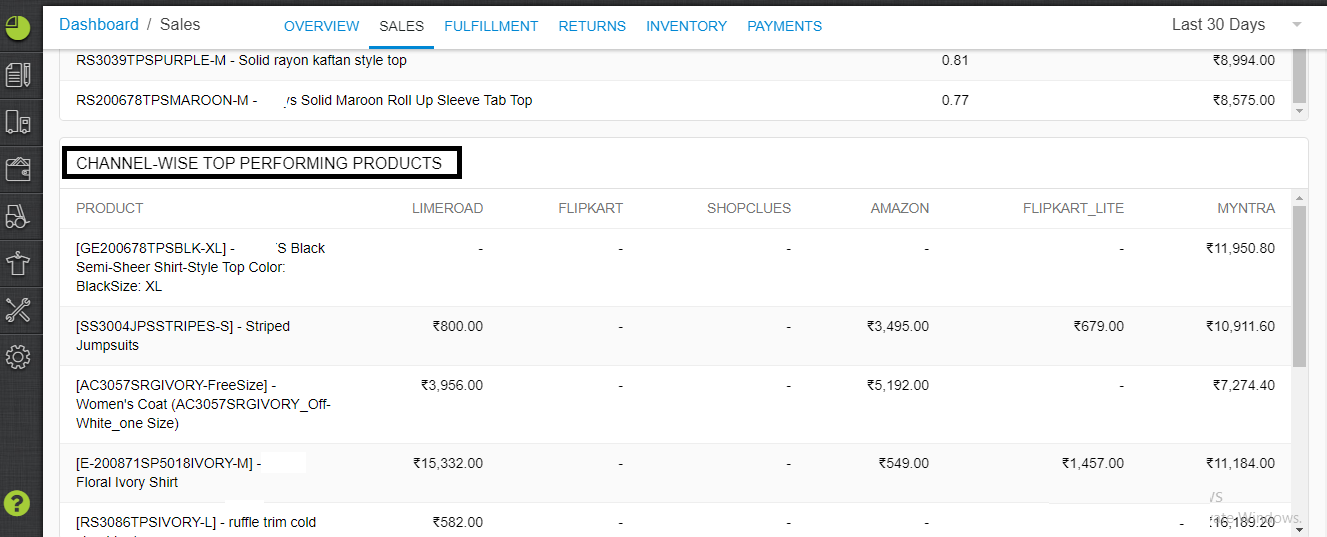
Section 4
Based on detailed analysis of your system and business trends, this section covers the list CHANNEL-WISE TOP PERFORMING PRODUCTS
_________________________________________________________________________